
Wednesday, November 24, 2010
Monday, November 1, 2010
Lab 9b: Spatial Analysis
1. There are 99 counties in Iowa
2. Fulton County
3. There are 31 cities
4. They are 4,105.6 miles long
5.
6. 1,441,652.8 acres of urban area are within LA county
7. 522 zip codes have their centroid in LA county
8. Kitigan Zibi Indian Reserve and Akwesasne Indian Reserve

9.

2. Fulton County
3. There are 31 cities
4. They are 4,105.6 miles long
5.

6. 1,441,652.8 acres of urban area are within LA county
7. 522 zip codes have their centroid in LA county
8. Kitigan Zibi Indian Reserve and Akwesasne Indian Reserve

9.

Lab 9A: Spatial Analysis
Part I. Boldstad Chapter 9 and Lecture
1. Spatial scope is the extent or area of the input data that are used in determining the values at output locations. The three types of spatial scope include local operations, neighborhood operations, and global operations.
2. The two types of algebra used in selection operations are set algebra and Boolean algebra. An example of set algebra would be “<” (less than). An example of Boolean algebra would be “and”, which narrows the selection.
3. The different spatial selection operations include: adjacency, containment, dissolving, overlay analyses (clip, intersect, or union), buffer, and spatial join.
Part II. Ormsby Chapters 10 & 11
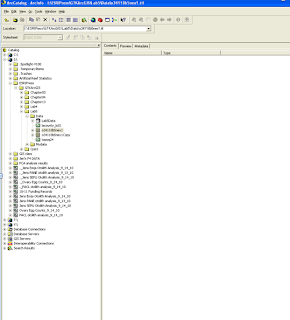
4. Yes, there is a feature dataset in the geodatabase called “LosAngeles”
5. The features present include: PtDumeQuad, Vegetation, and Wetlands Part III. Exercise 1
6. There are 10,896 records
7. There are 9 records after the dissolve operation
8. There are 8 records in the “vegCov_Clip” feature class
Part IV. Exercise 2
9. 404 records were selected
10. 123 records were selected

1. Spatial scope is the extent or area of the input data that are used in determining the values at output locations. The three types of spatial scope include local operations, neighborhood operations, and global operations.
2. The two types of algebra used in selection operations are set algebra and Boolean algebra. An example of set algebra would be “<” (less than). An example of Boolean algebra would be “and”, which narrows the selection.
3. The different spatial selection operations include: adjacency, containment, dissolving, overlay analyses (clip, intersect, or union), buffer, and spatial join.
Part II. Ormsby Chapters 10 & 11
4. Yes, there is a feature dataset in the geodatabase called “LosAngeles”
5. The features present include: PtDumeQuad, Vegetation, and Wetlands Part III. Exercise 1
6. There are 10,896 records
7. There are 9 records after the dissolve operation
8. There are 8 records in the “vegCov_Clip” feature class
Part IV. Exercise 2
9. 404 records were selected
10. 123 records were selected

Tuesday, October 26, 2010
Lab 8: Database Management and Queries
Boldstad Chapter 8 questions and answers
1. A database management system is a specialized computer program for organizing and manipulating data. It stores the properties of geographic objects and the relationships among the objects. Additionally, a DBMS incorporates a specialized set of software tools for managing tabular data, including those for efficient data storage, retrieval, indexing, and reporting.
2. In a one-to-one relationship, only one record connects to another. In a many-to-one relationship there are several records connect to one other record in a different table.
3. Relational databases prevent redundancy, increase data quality and independence, they create centralized control, and they allow multiple users.
Ormsby Chapter 8 & 9
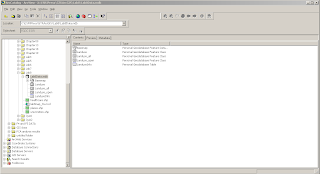
4a. String data (because it’s left-justified) Also, this can be determined by opening properties of layer and looking at fields (this tells you the data type)
4b. This is also string data
5a. LU_Description, LU_General, LU_Type, Sq. miles, and Acres are the fields that have been joined
5e. Total acres: 92,236.77
1. A database management system is a specialized computer program for organizing and manipulating data. It stores the properties of geographic objects and the relationships among the objects. Additionally, a DBMS incorporates a specialized set of software tools for managing tabular data, including those for efficient data storage, retrieval, indexing, and reporting.
2. In a one-to-one relationship, only one record connects to another. In a many-to-one relationship there are several records connect to one other record in a different table.
3. Relational databases prevent redundancy, increase data quality and independence, they create centralized control, and they allow multiple users.
Ormsby Chapter 8 & 9
4a. String data (because it’s left-justified) Also, this can be determined by opening properties of layer and looking at fields (this tells you the data type)
4b. This is also string data
5a. LU_Description, LU_General, LU_Type, Sq. miles, and Acres are the fields that have been joined
5e. Total acres: 92,236.77


Monday, October 11, 2010
Lab 7: Map Design and Text
Chapter 7
1. The information used for dynamic labels is based on layer attributes
2. The most efficient way to show city names for only 3 cities would be to use the label tool. To do this select the label tool and locate the city that you want to label. Click on the city you want to label and a label will automatically appear.
3. Yes, you can manually adjust the position by clicking on the label and moving it using the mouse. You can also right-click on the label and select “nudge object”. Finally, you can move the object by clicking on the label and using the arrow keys to move the label.
4. The select tool
5. Geodatabase and map annotation are the two annotation types
Chapter 18
1. A. true (you can create your own ArcMap templates)
2. Yes
3. One way is to start ArcMap and click the option to use a template, then click OK. Another way is to open a new document and select “template” in the drop-down menu.
4. You would click the symbol for the layer that contains your graphics. Using the symbol selector you can then change the size, symbol, and color.
5. You can select the symbol selector or you can select the fill color in the drawing toolbar.
Chapter 19
1. You should set the page size
2. Because there can be multiple data frames within layout view, you set the scale differently in layout view than in data view.
3. Three customization options for the scale bar include: the units, the number of divisions, and the number of subdivisions
4. It is important to use the 1:1 button to get a full view of how the map will look when it is printed.
5. A graphic added to the data view would track with the data frame when it is moved in layout view. A graphic added to the layout view does not move with the data frame.
Part 2:
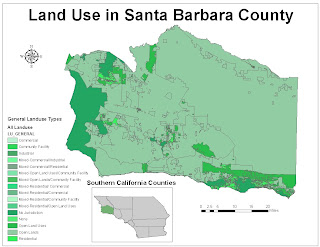
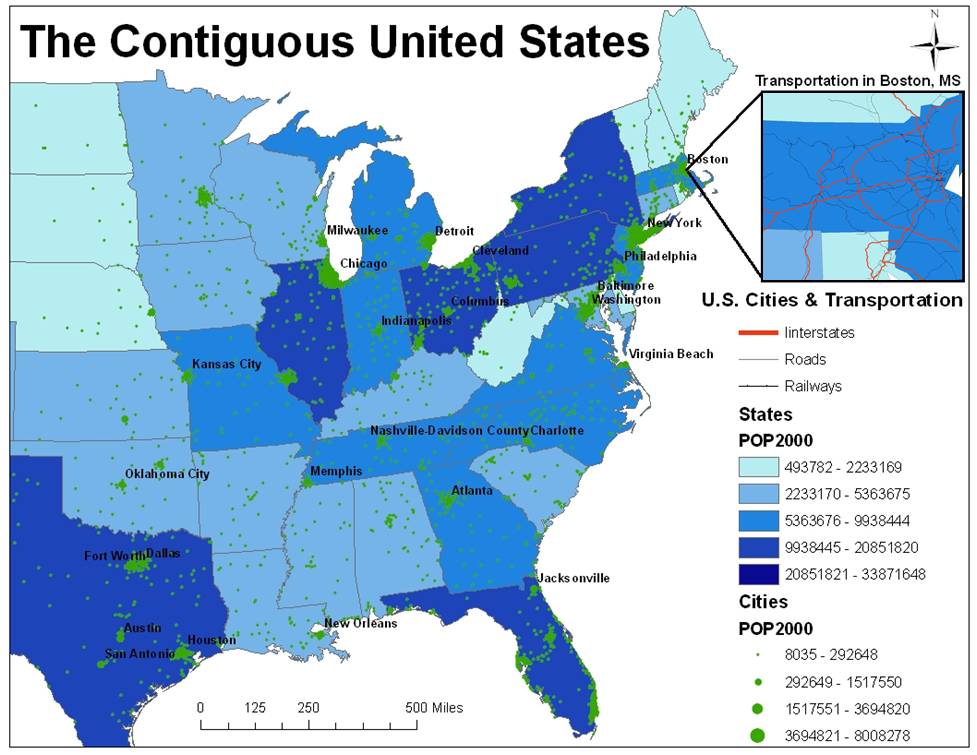
1. Choropleth maps classify numerical data into categories and the categories are shaded. This type of map puts visual emphasis on the largest area units of the map.
2. The benefits of layer files are that they allow you to define symbol assignments, classifications, labeling rules, and other map use properties.
3. Layer files include all map display properties for symbolization and labeling. However, layers do not usually contain the actual datasets. A layer package, on the other hand, contains the map layer, a copy of its data, and an SML file that has a brief description of the layer.
4. Population of Long Beach: 461,522
5. Population of Los Angeles: 3,694,820
6. The three types of hyperlinks include:
Document: When you click a feature with the Hyperlink tool, a document or file is launched using the application with which that file type is currently associated.
Uniform resource locator (URL): When you click a feature with the Hyperlink tool, a Web page is launched in the default Web browser.
Macro: When you click a feature with the Hyperlink tool, a value is sent to a macro. This option lets you create customized hyperlink behavior.
Wednesday, October 6, 2010
Lab 6: Symbolization and Classification

1. Depending on the scale at which you are viewing a map, the map features may appear different. For instance, if you are viewing a map of the United States at a small scale (ex.1 : 2,000,000), then cities may appear as tiny dots on the map. However, if you were to zoom in on a particular city at a large scale (ex. 1:200,000) then the city’s symbol may appear as a large polygon.
2. One way to change the layers symbol colors is by right-clicking the symbol for the layer to open the color palette and changing the color using the color palette. Another way is to right-click the layer and select properties in the drop-down menu. Then click the symbology tab in the layer properties dialog box. Next click the symbol box and change the color there.
3. To access graduated symbols open the layer properties dialog box for a specific layer. Then click the symbology tab and in the show box click quantities.
4. Five other symbology styles include: caves, civic, crime analysis, dimension, and environmental.
5. You would save the layer as a layer file. This allows you to add the layer file to any other map because it references the shapefile.
6. Pyramids help raster data display faster by varying the resolution of the raster dataset depending on the scale that the map is being viewed at. As you zoom in finer resolutions are used and as you zoom out courser resolutions are used. This improves the drawing speed of the raster layers as you zoom in or out.
7. You can click on the layer name in the table of contents and change the name that way.
8. Normalization is an operation by which you divide one attribute by another to find the ratio between them. It is used to calculate density and other measures that are expressed per unit (ex. Per capita income).
9. Dot density maps can be misleading because the dots on the map may lead a person interpreting the map to think that the dots are georeferenced. However, the dots are placed randomly on a map and are not georeferenced.
Wednesday, September 29, 2010
Lab 5: Digital Data
I. Questions based on lecture and book
1. Advantages of using digital spatial data include the following: it’s the easierst, quickest, and least expensive source for much spatial data. The disadvantage of digital spatial data is that because it is so readily available, you must check the source and metadata to make sure the data is reliable.
2. You must make sure that the coordinate projection system is the one that you need to use. You should also make sure that the data was collected and assembled by a reliable source. You should make sure that you’re using the most up-to-date version of that data by checking the metadata. You should check to make sure the resolution is good for what you want to do.
3. DOQs are images that have been corrected for distortions due to camera tilt, terrain displacement, and other factors.
4. The national elevation dataset is a seamless high resolution DEM of the United States produced by the USGS. This information is derived from both ground and aerial surveys. The National Hydrologic Dataset (NHD) compines data from USGS digital line graph data and the US EPA river “reach” data to create digital spatial data about surface waters including rivers, streams, canals, ditches, lakes, ponds springs, and wells. NHD data come from both ground and aerial surveys. National wetlands inventory (NwI) data are produced through a combination of land and aerial surveys as well This data is produced by the US Fish and Wildlife Service and they portray the characteristics of wetlands, including open water.
5. DEMs, or digital elevation maps, are data models in a raster format that provide elevation data. DEMs can be low or high resolution. DEMs make up the NED, national elevation dataset. The NED provides the highest-resolution DEM data for the United States and this data is seamless.
II. Answers to lab exercise
2a. The feature datasets are called “basemap” and “hydrology”
2b. The feature classes are NHDFlowline, NHDPoint, NHD Waterbody, and Watersheds
2c. NHDFlowline: line, NHDPoint: point, NHD Waterbody: polygon, and Watersheds: polygon
3a. Vector layer (metadata: description: expand data storage and access information: type of data)
3b. vector layer feature class, specifically a shapefile
3c. Yes
3d. Vector feature class
3e. Yes
3f. 3 keywords: hydrography, stream/river, and lake/pond
3g. Earth Science Information center, USGS
4. yes
6b. 34118-B5
7. black and white
8.

10.
12a. The lacount_lu01.shp layer was grayed out and had a red exclamation point next to it because it couldn’t find the data source
12b. To redirect the layer to the new data source name I right-clicked on the layer and selected properties. Then, I selected the source tab, set data source, and finally the lab 5 data folder and the correct data source.
Subscribe to:
Posts (Atom)