Chapter 7
1. The information used for dynamic labels is based on layer attributes
2. The most efficient way to show city names for only 3 cities would be to use the label tool. To do this select the label tool and locate the city that you want to label. Click on the city you want to label and a label will automatically appear.
3. Yes, you can manually adjust the position by clicking on the label and moving it using the mouse. You can also right-click on the label and select “nudge object”. Finally, you can move the object by clicking on the label and using the arrow keys to move the label.
4. The select tool
5. Geodatabase and map annotation are the two annotation types
Chapter 18
1. A. true (you can create your own ArcMap templates)
2. Yes
3. One way is to start ArcMap and click the option to use a template, then click OK. Another way is to open a new document and select “template” in the drop-down menu.
4. You would click the symbol for the layer that contains your graphics. Using the symbol selector you can then change the size, symbol, and color.
5. You can select the symbol selector or you can select the fill color in the drawing toolbar.
Chapter 19
1. You should set the page size
2. Because there can be multiple data frames within layout view, you set the scale differently in layout view than in data view.
3. Three customization options for the scale bar include: the units, the number of divisions, and the number of subdivisions
4. It is important to use the 1:1 button to get a full view of how the map will look when it is printed.
5. A graphic added to the data view would track with the data frame when it is moved in layout view. A graphic added to the layout view does not move with the data frame.
Part 2:
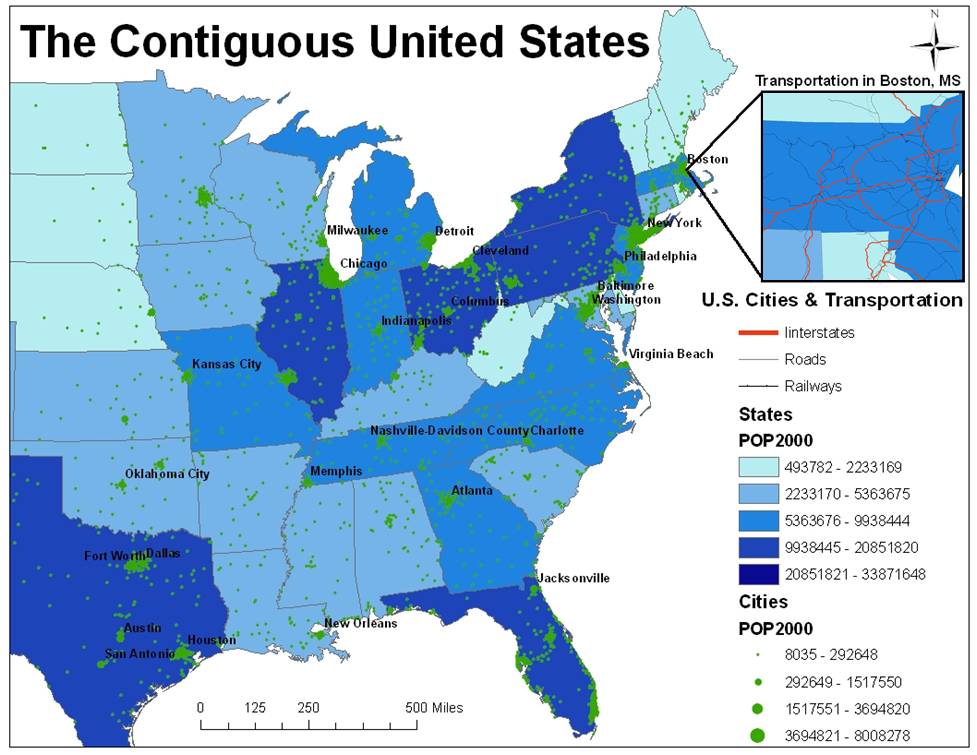
1. Choropleth maps classify numerical data into categories and the categories are shaded. This type of map puts visual emphasis on the largest area units of the map.
2. The benefits of layer files are that they allow you to define symbol assignments, classifications, labeling rules, and other map use properties.
3. Layer files include all map display properties for symbolization and labeling. However, layers do not usually contain the actual datasets. A layer package, on the other hand, contains the map layer, a copy of its data, and an SML file that has a brief description of the layer.
4. Population of Long Beach: 461,522
5. Population of Los Angeles: 3,694,820
6. The three types of hyperlinks include:
Document: When you click a feature with the Hyperlink tool, a document or file is launched using the application with which that file type is currently associated.
Uniform resource locator (URL): When you click a feature with the Hyperlink tool, a Web page is launched in the default Web browser.
Macro: When you click a feature with the Hyperlink tool, a value is sent to a macro. This option lets you create customized hyperlink behavior.
No comments:
Post a Comment