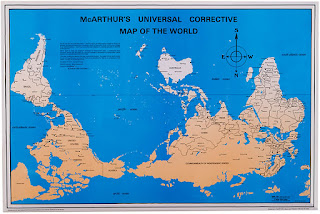
1a) Definitions of GIS:
A geographic information system (GIS) integrates hardware, software, and data for capturing, managing, analyzing, and displaying all forms of geographically referenced information.
(Source: http://www.gis.com/content/what-gis)
A geographic information system (GIS), or geographical information system, is any system that captures, stores, analyzes, manages, and presents data that are linked to location. In the simplest terms, GIS is the merging of cartography, statistical analysis, and database technology.
(Source: http://en.wikipedia.org/wiki/Geographic_information_system)
Geographic Information System or GIS is technology that offers a radically different way in which we produce and use the maps required to manage our communities and industries. GIS creates intelligent super maps through which sophisticated planning and analysis can be performed at the touch of a button.
(Source: http://www.satimagingcorp.com/svc/gismapping.html)
1b) Similarities among definitions
These definitions are similar in that they all define GIS as a geographic information system, not geographic information science. Additionally, all definitions describe GIS as a way to manage spatial data. The one other aspect that is similar among these definitions is that they all mention the ability of GIS to analyze this organized spatial data.
One of these definitions is very different from the other two definitions in that it focuses primarily on the applicability of GIS to community and industry planning. The first two definitions presented are very similar, yet the second definition differs by mentioning cartography and database technology as components of GIS.
1d) What does this tell you about the field of GIS?
Because the definitions are all somewhat different it suggests that GIS is a relatively new field in which the definition has not been fully agreed upon. Furthermore, it suggests that there are many different aspects to and applications of GIS technology which may be difficult to encompass in one definition.
2) Three real world applications of GIS
In a study by Sposito et al. 2009, the authors used GIS to identify potential agricultural regions in the Southwest region of Victoria Australia that are under threat of decreased productivity due to climate change. In order to identify these potentially high risk areas the authors combined information about land suitability in the area with regional optimization analyses under the current and predicted future climatic conditions. This type of research is becoming increasingly important worldwide as climate is predicted to rapidly change in the next century. (Source: Application of GIS-based computer modeling to planning for adaption to climate change in rural areas by Sposito, V., Benke, K., Pelizaro, C. & Wyatt, R).
A second example of an application of GIS is demonstrated by the work of Adams (2007). This study investigated potential areas of land-use conflict in the central region of Australia's desert. In order to determine where these potential conflicts might occur Adams incorporated information about aborginal communities, tourism sites, pastoral leases, national parks land, and the degree of interest in the parcels of land. By overlaying information about each of these land types he was able to find potential areas of conflict. (Source: Exploratory GIS modeling for assessing potential conflict in Australia's central desert region by Adams, B. Jon)
A final example of a useful application of GIS is given in a study by Cloutier et al. (2007) in which the authors used GIS to determine if the occurrence of child pedestrian accidents are related to the distance to an elementary school. Cloutier and others combined socio-economic information as well as environmental data in order to integrate information about the local environment into a spatial analysis of child pedestrian accidents. They found that on average these accidents occur primarily within 500 meters of the closest school. This finding is important because in the future information about the neighborhood surrounding a school can be considered before placing a school in the area in order to minimize the risk of child pedestrian accidents. (Source: GIS-based spatial analysis of child pedestrian accidents near primary schools in Montreal, Canada by Cloutier, M., Apparicio, P., and Thouez, J.)
3) Three differences and three similarities between GIS and maps
Both GIS and maps use spatial data to give us a better understanding of where things are situated in the world. Additionally, both GIS and maps communicate information about attributes of spatial information through the use of symbols. Finally, GIS is obviously similar to maps because it incorporates the use of maps. However, GIS is different than a normal map because while it incorporates the use of maps it also adds additional data to the map to create a 'super map'. In other words, maps are concerned with the representation of spatial data, whereas GIS is more concerned with the analysis of spatial data. For instance, while a normal map shows a combination of layers all put together (streams, rives, county borders, etc), a GIS map stores each of these layers separately and puts the layers on top of each other to create a map. Finally, features of GIS maps can be easily manipulated to find the answers to complex problems through statistical analyses, this is something that would be very difficult if not impossible to do using normal maps.


