2. It would be better to create, symbolize, and analyze maps in data view. The layout view should only be used for organizing maps to be printed.
3. One way to obtain help is to click on the “what’s this” tool on the toolbar (or you can get to it through the help menu) and place the pointer over an object that you have a question about. Another way to get help is to go to the help menu and click on “ArcGIS Desktop Help” or press F1.
4. Attributes are linked to geographic features through an attribute table. You can get to the attribute table by right-clicking on a layer in the TOC menu and selecting open attribute table.
5. The file called a map document, “.mxd”
6. One way to zoom in is to click on the magnifying glass on the tools toolbar and then use the magnifying glass to click on a part of the map that you want to zoom in on. Another way is to use the magnifying glass to select a box that you want to zoom in on.
7. Three operation available include: label features, open attribute table, and zoom to layer.
8. This means that the data for that layer is not able to be viewed because the scale of the map is not correct. You would need to either zoom in or zoom out in order to view the grayed out layer.
9. A small scale map is, for example, a map of the United States in which the scale could conceivably be 1: 500,000. This is called a small scale map because the fraction 1/500,000 is very small. An example of a large scale map is a map of the CSUN campus, which might have a scale of 1:10 (a much larger fraction).
10. A feature is a geographic object in a layer. Features have a variety of shapes (polygon, line, or point) and sizes. Also, features are linked to information through an attribute table. A surface is a single, continuous geographic expanse, for example the ocean is represented by a surface. A surface is made up of different values for each location on the earth’s surface and is generally represented by a raster.
11. Create project criteria
12. The minimum elevation was at New Orleans and it was 0ft above sea level. The maximum elevation was at Tuscon and it was 1045 ft above sea level. In order to find these numbers I opened the attribute table for cities and organized the table by elevation.
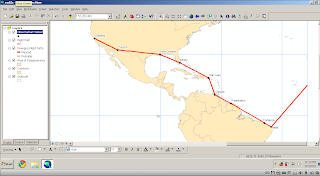
13. The distance from Dakar to Assab is approximately 4,172 miles. You can determine the approximate distance by using the measure tool. I suppose you could also open the attribute table for flight path and sum the distances between each of the cities from Dakar to Assab. However, that would not give a very accurate measurement of the distance.
14. You could right click on the cities layer and select label features. This would label all of the cities shown on the map. Or, you could use the identify tool and click on a city to find out the name of the city.
15.

No comments:
Post a Comment